New York Agriculture Map
A custom interactive agricultural map of New York State, built for New York Agriculture in the Classroom.
For more than forty years, New York Agriculture in the Classroom has helped educators, students, and their communities across New York learn about agriculture and the food and fiber it produces. They are a partnership of Cornell University, the New York State Department of Agriculture and Markets, the New York State Education Department, Cornell Cooperative Extension, and the New York Farm Bureau. Their office is in Ithaca, and they work with teachers from pre-K through high school, along with farmers, volunteers, and community educators. Each spring, they invite volunteers into classrooms throughout the state for Agricultural Literacy Week, to read a book about agriculture with students and lead hands-on activities about where their food comes from.
Website Design
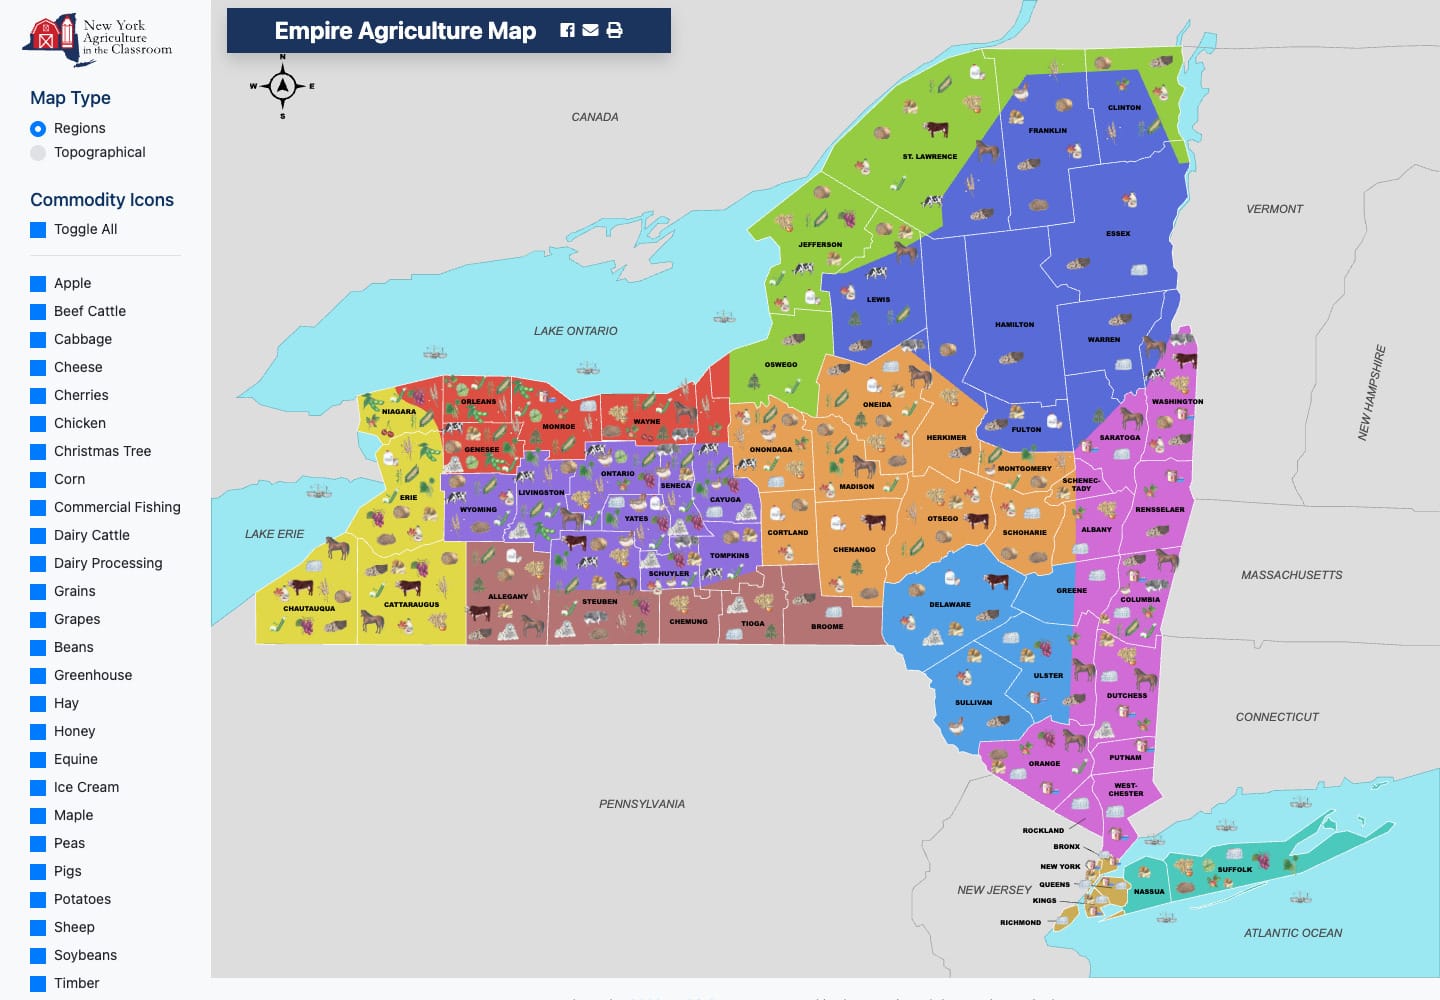
New York Agriculture in the Classroom’s team had planned the map over many staff meetings and discussions, and they chose us to bring it to life. We designed the Empire Agriculture Map from their plans and built it from scratch in WordPress, so New York’s students and teachers can explore their state’s agriculture county by county. They can click any commodity on the map to find out about it, or switch commodities off to focus on a few. Choosing a region takes them to a section about its land, soil, and climate, with a map where each county opens to its top five agricultural products. Working together from across the country went smoothly, and once the map was built, we showed their team how it all works, so the text for every region, county, and commodity is in their hands.
Website Hosting & Maintenance
Whenever New York Agriculture in the Classroom has wanted to add to the Empire Agriculture Map, which we host, they have come to us. In 2025, that meant adding cabbage and chicken to its commodities, placing icons on each region’s map, and giving every commodity a button that links to more about it on their main website. Monthly backups keep a copy of the map and all of the text behind it, and the site is monitored nonstop. With hundreds of icons on the map, we pay close attention to its speed, so it doesn’t keep students and educators waiting.
03 — The Work
Students pick a county and see what it produces.
04 — Praise From the Client
Over many staff meetings and discussions at NY Agriculture in the Classroom, we had conceptually outlined and designed an educational agriculture map and were looking for a designer to bring our ideas to life. Abide was referred to us from one of our partner organizations for work they did on a similar project. After going through multiple bids, we chose Abide and we are so glad we did.
Although we are across the country from their headquarters, there were no problems communicating, meeting, and implementing our project. Josh and David were wonderful to work with. Although we are not web designers, they did an amazing jobs communicating the programming process/language and providing education on how the systems work once developed.
The final product is phenomenal and we look forward to sharing the interactive resource with students and educators from across the state and to work with Abide on future phases of the resource.
Jeremiah Best
Program Manager
Let’s talk
Want results like this for your organization?
Book a free 15–30 minute call and we’ll talk through your project — no pressure, no obligation.